(R1b-A5388)
Michael Cooley
R1b-A5388 is a subclade in the Cenél nEógain Y-DNA Project. Per the Wikipedia article, Branches of the Cenél nEógain , "Cenél nEógain or Kinel-Owen ('Kindred of Owen') are a branch of the Northern Uí Néill, who claim descent from Eógan mac Néill, son of Niall of the Nine Hostages." Jim Wilson and I are co-administrators of the Cenél nEógain Y-DNA Project and are tasked to manage and report on the A5388 group. Questions may be addressed to either or both of us.
The following table is simply a bare summary of the results and can be copied and pasted into a spreadsheet. This is helpful for keeping track of larger projects. With the exception of those indicated by an asterisk, the novel SNPs (novel variants) can be tested at YSEQ.net for $18 each and a one-time kit fee of $6 for the first order.
| KIT | TREE | MRCA | TEST | NOVEL VARIANTS | ||||||||||||||||||||||||||||||||||||||||||||||||||||||||||||||||||||||||||||||||||||||||||||||||||||||||||||||||||||||||||||||||||||||||||||||||||||||||||||||||
| #B177041 | | FT303680
| #N119097 | FT211621
| #B116020 | --
| #N8220 | BY109328 BY110339 BY116213
| #1004866 | FTC7489 MF258591 FTE93508 FTE93625 FTE93761 FTE93810 FTE93848 FTE93917
| #IN93193 | FTC96552 19358211=CT FTC97264 FTC96066 FTD2105 FTD2285 FTD2651
| #214886 | BY18229
| #400441 | BY18202 Y51373 Y51336
| #908382 | FTC70414 FTC70415 FTC70416
| #921210 | FT230808 FT230259 FT230211 FT230837
| #IN88911 | FTC82425 FTC82483 FTC82629 FTC82344
| #524028 | FTE67959 FTE70278 FTE67158
| #307767 | FTD15506 FTD16423 FTD16632 FTD19525
| #42029 | BY104783 FT157958 FT158246
| #70755 | BY140790 BY18206 BY18211
| #1013776 | FTF73220 FTF71351
| #792392 | FTD19311 FTD12698
| #744248 | --
| #993066 | FTD84680
| #78346 | --
| #913051 | FTB37804
| #937024 | FTD9616 FTB78283 FTD11011 FTD11283 FTD9270
| #MI53913 | FT237429 FT238044 FT238049 FT238050 FT235430 FT236262
| #197468 | FTF72489 FTF73706 FTF74416 26626787=GA
| #N117876 | BY101136
| #896154 | --
| #275331 | FTB29150 FTB31347 FT388169
| #IN108750 | --
| #MI15094 | FTB78880
| #232911 | FT170037 MF5317 FT170672
| #191634 | FTF4307
| #482950 | FTE54714 FTE54723 FTE54913 FTE55214 FTE55681 FTE54311 MF657258
| #975153 | M6943 FTC29438 FTC30182 FTC31541 FTC35459 FTC26787 FTC35767
| |
* SNP cannot undergo Sanger testing
A SNP (Single Nucleotide Polymorphism) occurs when there's a genetic change at a single position, for example an A mutated to a C. Each marker listed in the tree below is a SNP, and each one was manifested at the birth of a single man. This doesn't happen every generation but, if we had enough data, they'd all line up one after the other in a timeline. In other words, each of these markers is a direct representative of a specific man born at a specific time and place. For that reason, I like to say that "SNPs are people too." It's not literally true, of course, but conjures an image that is reasonably apropos.

Every marker above is a direct genetic representation of the first man born with that marker. However, each marker could represent three or four more men not born with a new, unique marker.
Count the number of markers upstream of any one kit. Then multiply that by four generations. I'll leave it to you detemine how many years makes a generation. This can be done for all kits descended from any one haplogroup. Average the grand total to get an average timeline for the haplogroup. The word "average" is, however, the key. The more participants, the more that number will change.
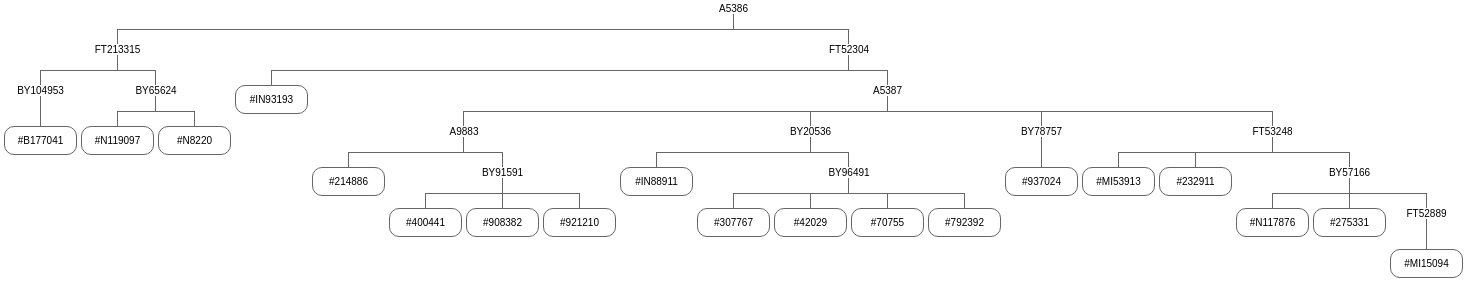
This is a simplified, barebones, stripped-down SNP Tree (as above). It's called a Quick Tree merely because it can be created once new results are downloaded. It has the advantage of allowing a tested group member to easily trace their SNP lineage.
| A5386 A5389 A5390 FT53375 FT53563 FT91554 FTB28678 Y30883 (FT230259) FT213315 BY104953 BY134836 FT303680
| A5386 A5389 A5390 FT53375 FT53563 FT91554 FTB28678 Y30883 (FT230259) FT213315 BY65624 BY133978 FGC57178 FT211621
| A5386 A5389 A5390 FT53375 FT53563 FT91554 FTB28678 Y30883 (FT230259) FT213315 BY65624 BY133978 FGC57178 --
| A5386 A5389 A5390 FT53375 FT53563 FT91554 FTB28678 Y30883 (FT230259) FT213315 BY65624 BY133978 FGC57178 BY109328 BY110339 BY116213
| A5386 A5389 A5390 FT53375 FT53563 FT91554 FTB28678 Y30883 (FT230259) FT213315 FGC57178 FTC7489 MF258591 FTE93508 FTE93625 FTE93761 FTE93810 FTE93848 FTE93917
| A5386 A5389 A5390 FT53375 FT53563 FT91554 FTB28678 Y30883 (FT230259) FT52304 FT52594 FTB28823 FTC96552 19358211=CT FTC97264 FTC96066 FTD2105 FTD2285 FTD2651
| A5386 A5389 A5390 FT53375 FT53563 FT91554 FTB28678 Y30883 (FT230259) FT52304 FT52594 FTB28823 A5387 A9883 BY18229
| A5386 A5389 A5390 FT53375 FT53563 FT91554 FTB28678 Y30883 (FT230259) FT52304 FT52594 FTB28823 A5387 A9883 BY91591 Y60045 BY18202 Y51373 Y51336
| A5386 A5389 A5390 FT53375 FT53563 FT91554 FTB28678 Y30883 (FT230259) FT52304 FT52594 FTB28823 A5387 A9883 BY91591 Y60045 FTC70414 FTC70415 FTC70416
| A5386 A5389 A5390 FT53375 FT53563 FT91554 FTB28678 Y30883 (FT230259) FT52304 FT52594 FTB28823 A5387 A9883 BY91591 Y60045 FT230808 FT230259 FT230211 FT230837
| A5386 A5389 A5390 FT53375 FT53563 FT91554 FTB28678 Y30883 (FT230259) FT52304 FT52594 FTB28823 A5387 BY20536 BY18219 BY43658 FT165129 FT165130 FT89403 FTC82425 FTC82483 FTC82629 FTC82344
| A5386 A5389 A5390 FT53375 FT53563 FT91554 FTB28678 Y30883 (FT230259) FT52304 FT52594 FTB28823 A5387 BY20536 BY18219 BY43658 FT165129 FT165130 FT89403 FTE67959 FTE70278 FTE67158
| A5386 A5389 A5390 FT53375 FT53563 FT91554 FTB28678 Y30883 (FT230259) FT52304 FT52594 FTB28823 A5387 BY20536 BY18219 BY43658 FT165129 FT165130 FT89403 BY96491 BY42627 FTD15506 FTD16423 FTD16632 FTD19525
| A5386 A5389 A5390 FT53375 FT53563 FT91554 FTB28678 Y30883 (FT230259) FT52304 FT52594 FTB28823 A5387 BY20536 BY18219 BY43658 FT165129 FT165130 FT89403 BY96491 BY42627 BY104783 FT157958 FT158246
| A5386 A5389 A5390 FT53375 FT53563 FT91554 FTB28678 Y30883 (FT230259) FT52304 FT52594 FTB28823 A5387 BY20536 BY18219 BY43658 FT165129 FT165130 FT89403 BY96491 BY42627 BY140790 BY18206 BY18211
| A5386 A5389 A5390 FT53375 FT53563 FT91554 FTB28678 Y30883 (FT230259) FT52304 FT52594 FTB28823 A5387 BY20536 BY18219 BY43658 FT165129 FT165130 FT89403 BY96491 BY42627 FTF73220 FTF71351
| A5386 A5389 A5390 FT53375 FT53563 FT91554 FTB28678 Y30883 (FT230259) FT52304 FT52594 FTB28823 A5387 BY20536 BY18219 BY43658 FT165129 FT165130 FT89403 BY96491 BY42627 FTD19311 FTD12698
| A5386 A5389 A5390 FT53375 FT53563 FT91554 FTB28678 Y30883 (FT230259) FT52304 FT52594 FTB28823 A5387 BY20536 BY18219 BY43658 FT165129 FT165130 FT89403 Z19785 --
| A5386 A5389 A5390 FT53375 FT53563 FT91554 FTB28678 Y30883 (FT230259) FT52304 FT52594 FTB28823 A5387 BY20536 BY18219 BY43658 FT165129 FT165130 FT89403 Z19785 FTD84680
| A5386 A5389 A5390 FT53375 FT53563 FT91554 FTB28678 Y30883 (FT230259) FT52304 FT52594 FTB28823 A5387 BY20536 BY18219 BY43658 FT165129 FT165130 FT89403 Z19785 --
| A5386 A5389 A5390 FT53375 FT53563 FT91554 FTB28678 Y30883 (FT230259) FT52304 FT52594 FTB28823 A5387 BY20536 BY18219 BY43658 FT165129 FT165130 FT89403 Z19785 FTB37804
| A5386 A5389 A5390 FT53375 FT53563 FT91554 FTB28678 Y30883 (FT230259) FT52304 FT52594 FTB28823 A5387 BY78757 BY123092 FTD9616 FTB78283 FTD11011 FTD11283 FTD9270
| A5386 A5389 A5390 FT53375 FT53563 FT91554 FTB28678 Y30883 (FT230259) FT52304 FT52594 FTB28823 A5387 FT53248 FT237429 FT238044 FT238049 FT238050 FT235430 FT236262
| A5386 A5389 A5390 FT53375 FT53563 FT91554 FTB28678 Y30883 (FT230259) FT52304 FT52594 FTB28823 A5387 FT53248 FTF72489 FTF73706 FTF74416 26626787=GA
| A5386 A5389 A5390 FT53375 FT53563 FT91554 FTB28678 Y30883 (FT230259) FT52304 FT52594 FTB28823 A5387 FT53248 BY57166 BY124944 BY146581 FT303165 FTB88200 BY101136
| A5386 A5389 A5390 FT53375 FT53563 FT91554 FTB28678 Y30883 (FT230259) FT52304 FT52594 FTB28823 A5387 FT53248 BY57166 BY124944 BY146581 FT303165 FTB88200 --
| A5386 A5389 A5390 FT53375 FT53563 FT91554 FTB28678 Y30883 (FT230259) FT52304 FT52594 FTB28823 A5387 FT53248 BY57166 BY124944 BY146581 FT303165 FTB88200 FTB29150 FTB31347 FT388169
| A5386 A5389 A5390 FT53375 FT53563 FT91554 FTB28678 Y30883 (FT230259) FT52304 FT52594 FTB28823 A5387 FT53248 BY57166 BY124944 BY146581 FT303165 FTB88200 FT52889 FT283968 FT52368 FT52993 FT54911 FTB76260 --
| A5386 A5389 A5390 FT53375 FT53563 FT91554 FTB28678 Y30883 (FT230259) FT52304 FT52594 FTB28823 A5387 FT53248 BY57166 BY124944 BY146581 FT303165 FTB88200 FT52889 FT283968 FT52368 FT52993 FT54911 FTB76260 FTB78880
| A5386 A5389 A5390 FT53375 FT53563 FT91554 FTB28678 Y30883 (FT230259) FT52304 FT52594 FTB28823 A5387 FT53248 FT393632 FT170672 FT170037 MF5317 FT170672
| A5386 A5389 A5390 FT53375 FT53563 FT91554 FTB28678 Y30883 (FT230259) FT52304 FT52594 FTB28823 A5387 FT53248 FT393632 FTE89027 FTE90734 FTE90819 FTE91596 FTF1326 FTF1485 FTF4307
| FTC27704 FTC28488 FTC30667 FTE54714 FTE54723 FTE54913 FTE55214 FTE55681 FTE54311 MF657258
| FTC27704 FTC28488 FTC30667 M6943 FTC29438 FTC30182 FTC31541 FTC35459 FTC26787 FTC35767
|
Total SNPs: 649 |
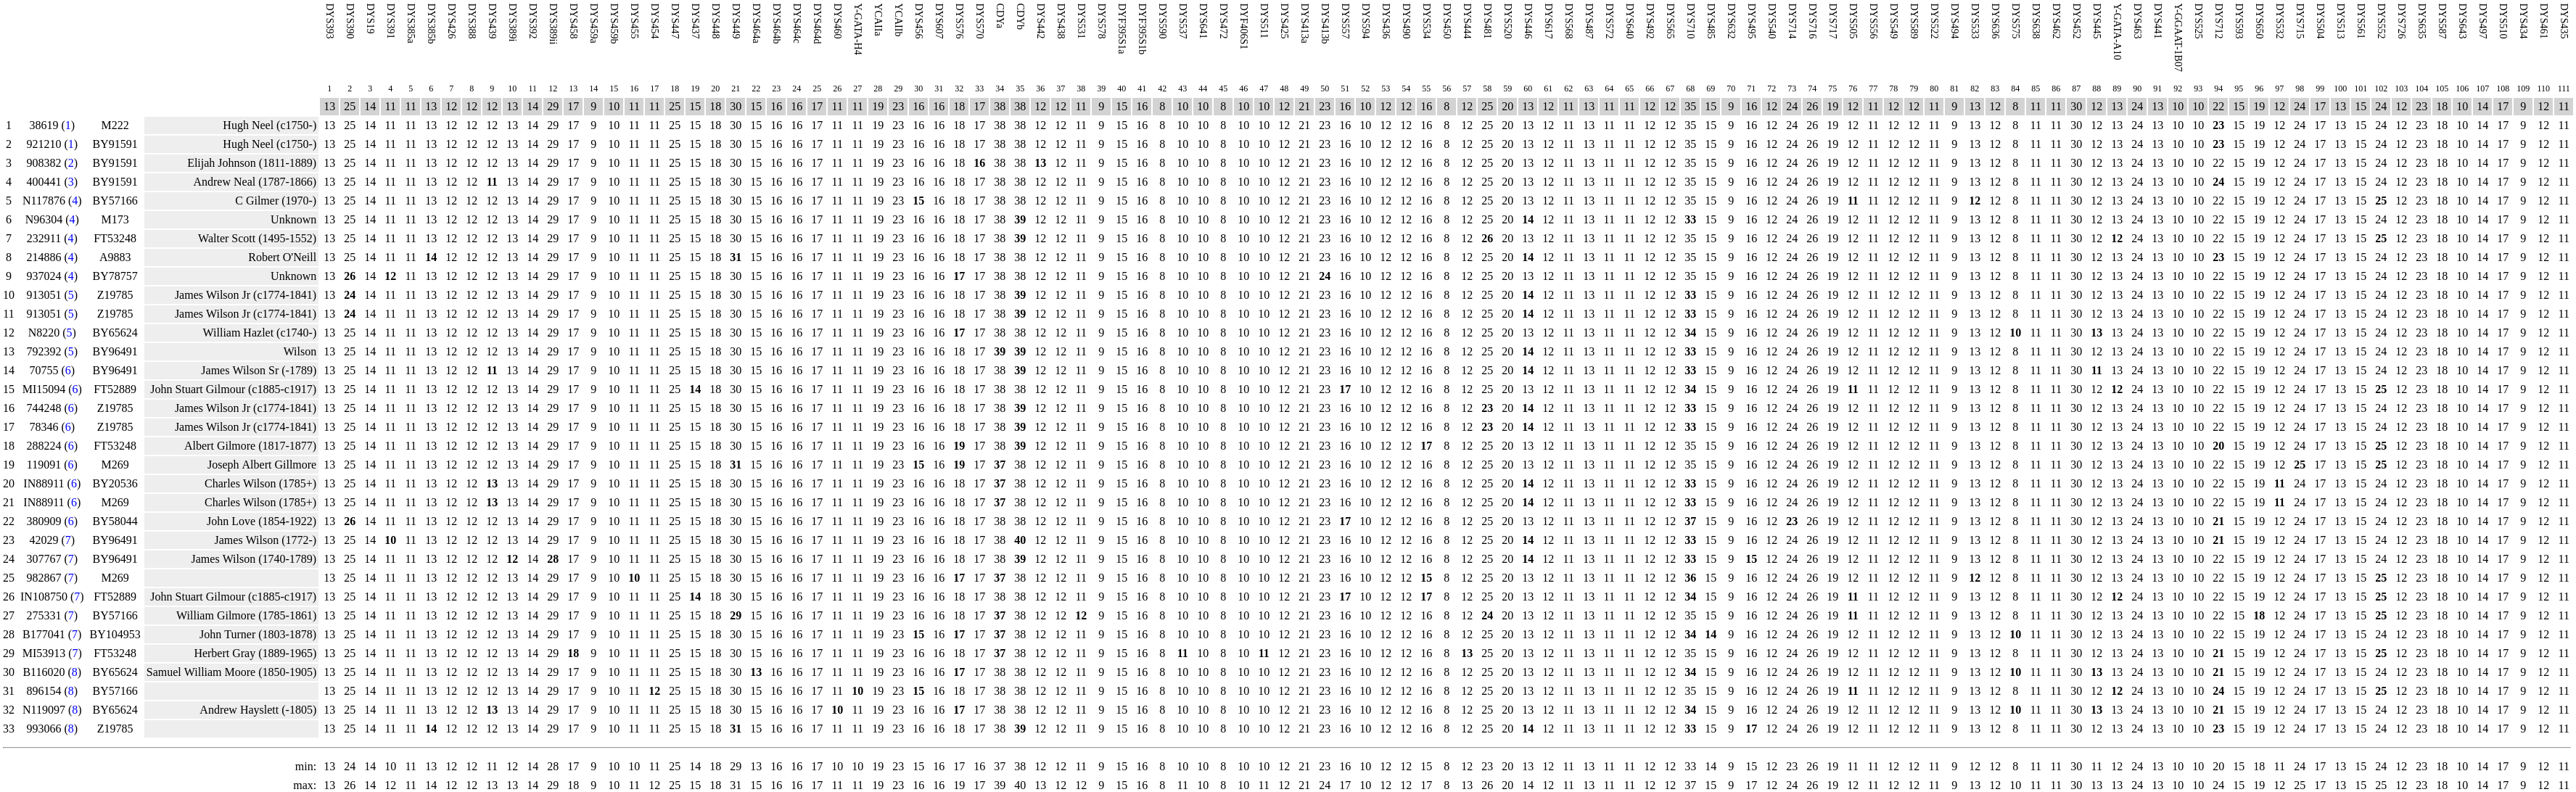
STRs (Short Tandem Repeats) are the markers found on the results page of every FTDNA project. They're completely different from SNPs. For example, the number in the first column for the following markers, labeled DYS393, is merely the count of the number of times the sequence AGAT is repeated in the tester's cells. More about the markers can be found on the Wikipedia page for List of Y-STR markers.
The top line in this graphic, in gray, is the modal value. It represents the most common value found among each tester. The total number of mismatches any one tester has to the modal is noted in blue parenthesis next to the tester's kit number. This number is referred to as the genetic distance or GD. For example, a tester might be a GD of 1 from the modal's CDYb marker but with a total GD of 5 from the modal as a whole.
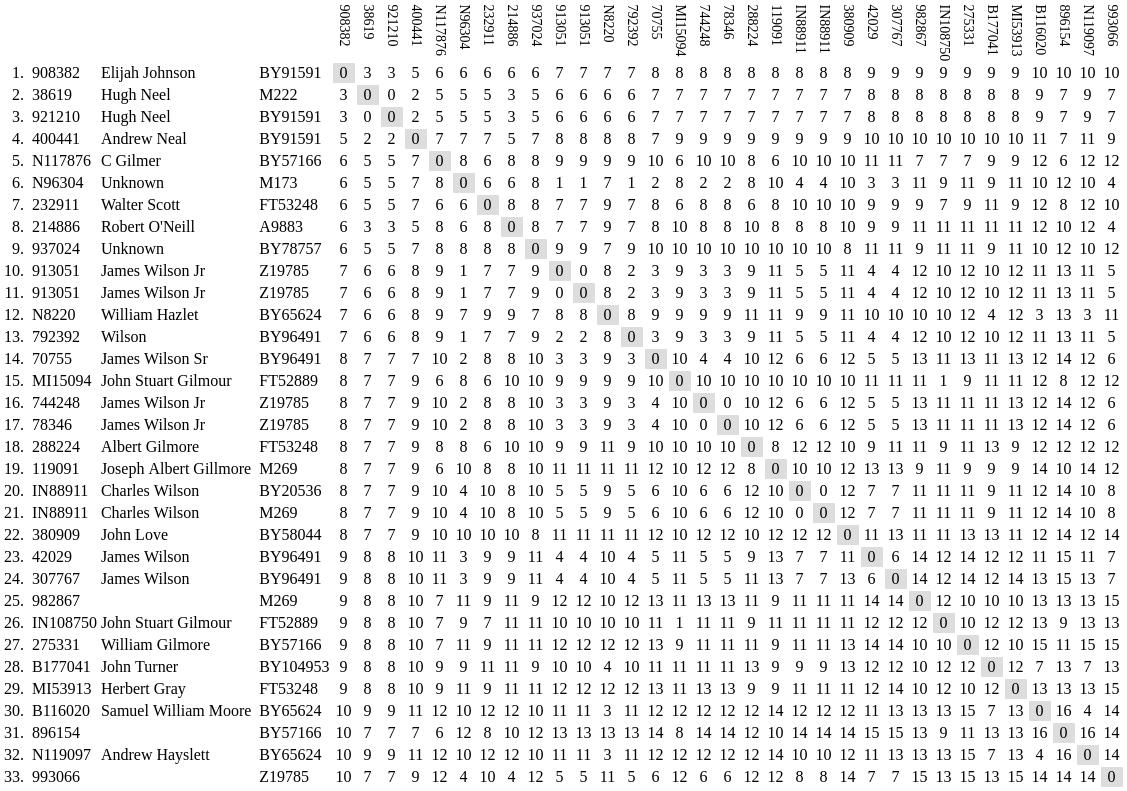
Here we compare the genetic distance between each tester rather than to the modal. This gives us a better idea as to how closely the testers are related to one another as opposed each to the modal, or mutual ancestor. The results tend to clump together by haplogroup. However, due to the volatile nature of STRs, the clumping is often inconsistent, as shown by the same graphics in the somewhat larger YP4248 Subclade Project. For this reason, STRs are unreliable for phylogeny. Nevertheless, the study can help direct us toward those kits that could provide the greatest impact on the project for Big Y upgrades.
The color version results from replacing the numeric values with color values. This doesn't tell us much for small groups but can be informative for groups of ten and more.